


What 7% Mortgages Mean for Housing and the Economy
Terry Herr, CFP®
The housing market is important both on a personal level as well as for the broader economy and financial system. For many households, owning a home is an accomplishment that requires years of planning and saving, representing their largest asset, most significant monthly expense, and main source of debt. The housing market is also a large part of the overall economy, accounting for between 15% and 18% of the country’s economic activity.1 When combined with the overall wealth effect of the housing market, these factors can impact consumer sentiment, household balance sheets, and the pace of overall economic growth.
One factor that directly impacts the housing market is interest rates. When rates rise, mortgage costs for new applicants rise as well, affecting everything from loan qualification to the volume of home sales. The average 30-year fixed mortgage rate is now back above 7% after falling toward 6% at the start of the year. While mortgage rates have been volatile in recent years, they have not been sustainably at these levels in nearly 25 years. What could these housing market pressures mean for households and the broader economy?
Mortgage rates are back above 7%
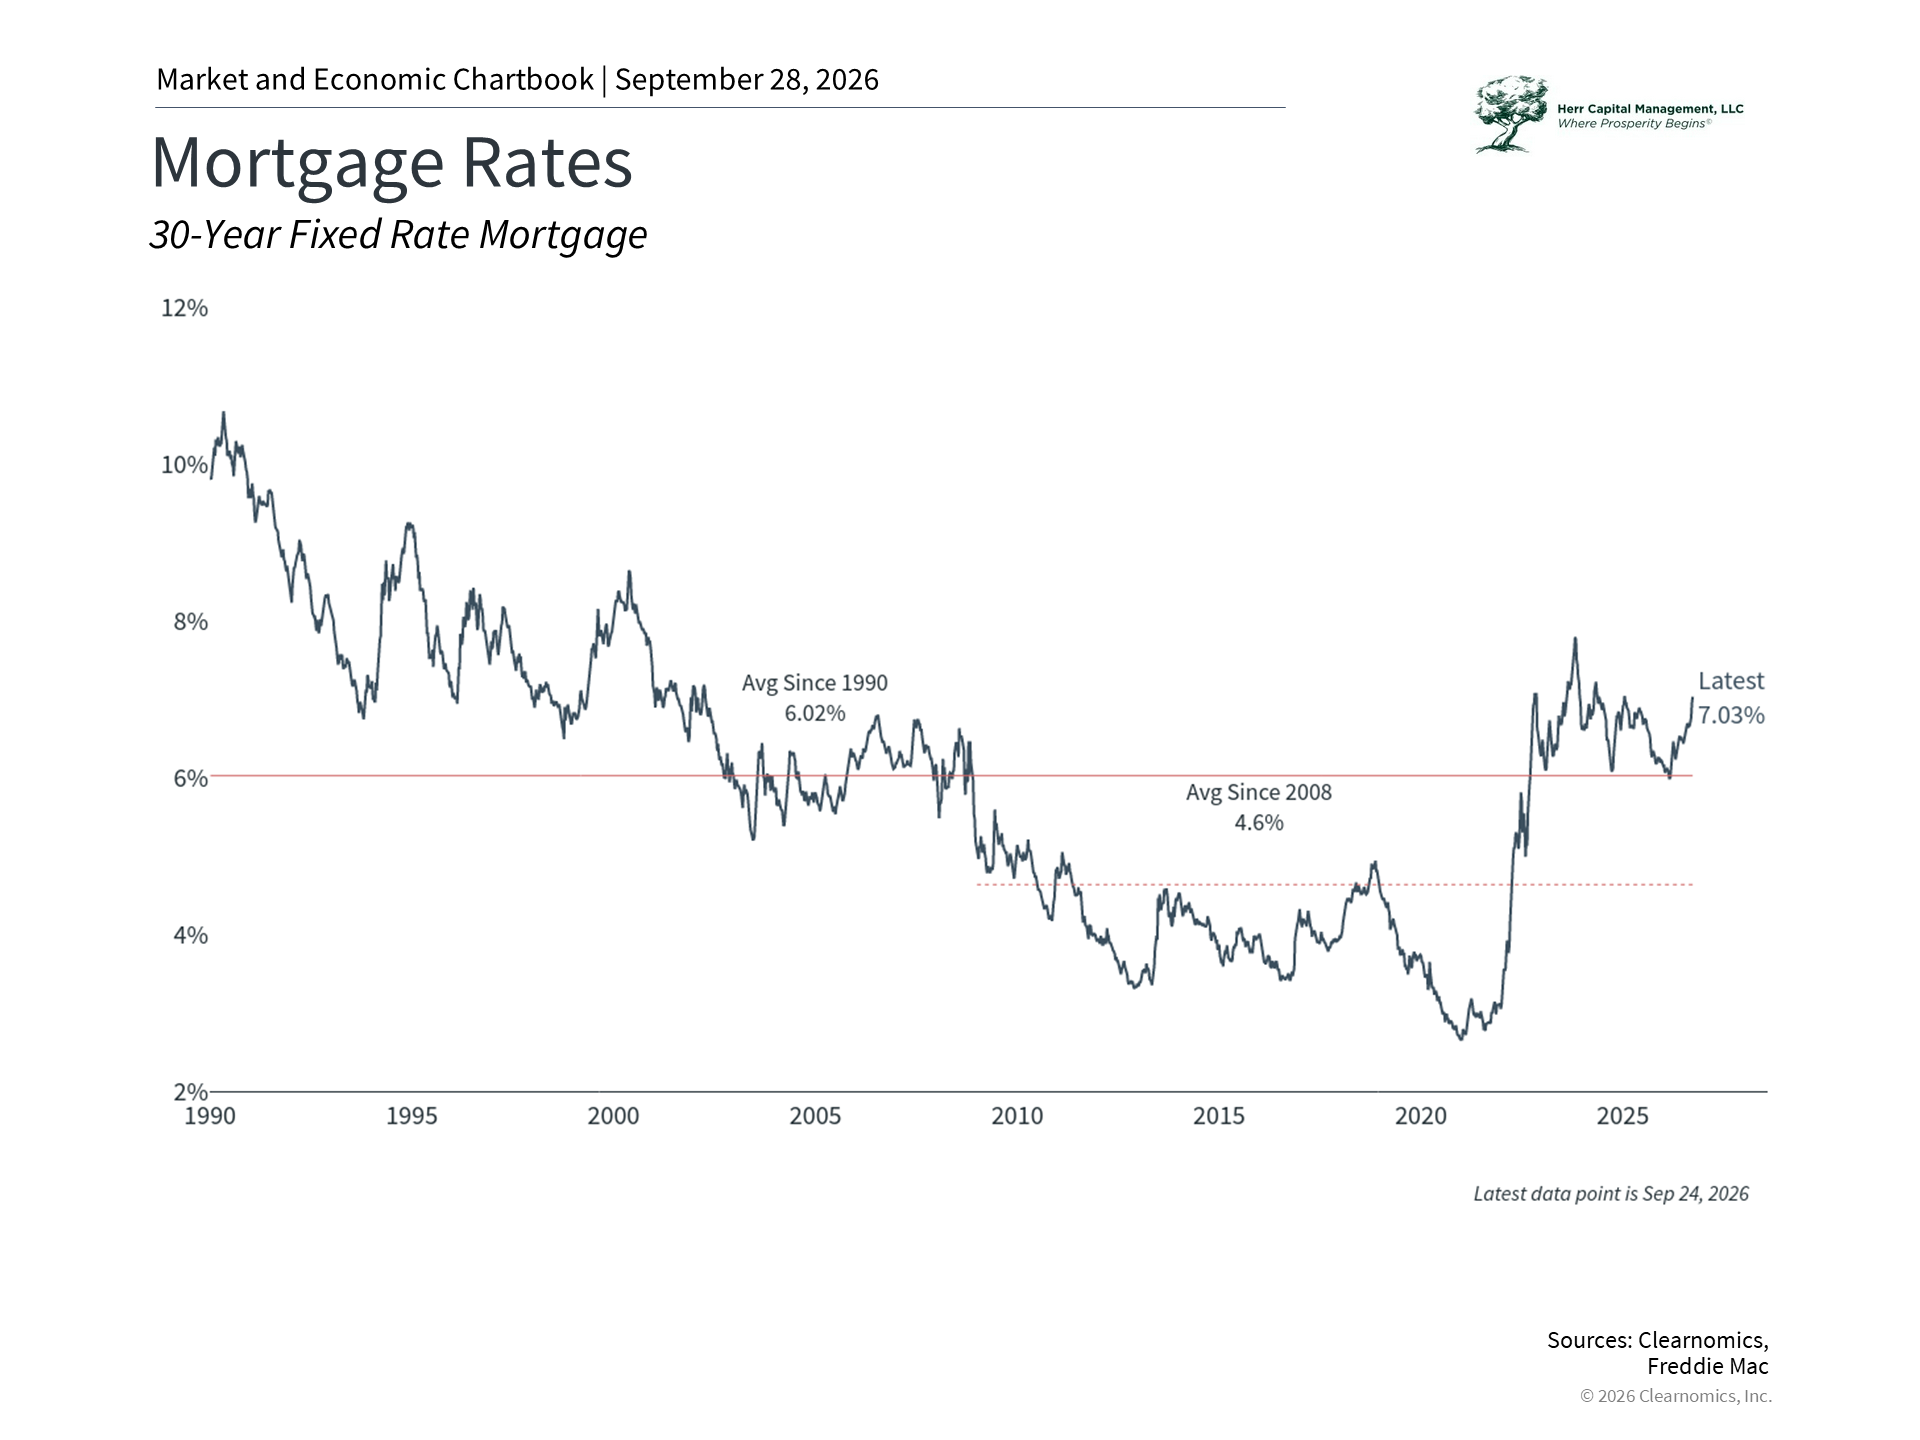 |
Mortgage rates had been declining alongside long-term Treasury yields from the early 1980s to 2020, when they bottomed out during the pandemic. From 1990 to the 2008 financial crisis, the long-run average for 30-year fixed rates was 6%. In contrast, the average since then has been only 4.6%. For much of the past decade, and particularly during the pandemic years when rates fell to 3% or below, many buyers and homeowners became accustomed to financing costs that were well below these historical norms.
So, the return to 7% can raise questions on the economics of homeownership. One of the biggest consequences is what economists refer to as the "lock-in" effect. Homeowners who secured low fixed rates in prior years face a disincentive to sell their homes, since doing so would require taking on a new mortgage at today's significantly higher rate. This reduces the supply of existing homes coming to market, which in turn can keep transaction volumes low. In fact, Washington policymakers are considering solutions such as “portable mortgages” that would allow homeowners to transfer their lower rates to new homes.
According to the National Association of Realtors, existing home sales fell 2.0% month-over-month and 1.2% year-over-year in August, reflecting continued softness in market activity.2 The inventory of existing homes now stands at 4.9 months of supply, and new homes now stand at 8.5 months, the highest levels in over a decade.3 While higher inventories are positive, these figures are calculated based on the rate of sales activity, so they could reflect homes sitting on the market longer.
For buyers who do enter the market, it’s clear that higher rates have a direct effect on affordability, since a larger share of monthly income must go toward mortgage debt service. This creates an incentive to wait for rates to improve, delaying housing activity further, with difficult tradeoffs to make in terms of location, size, or down payment.
Despite slow activity, home prices remain near record levels
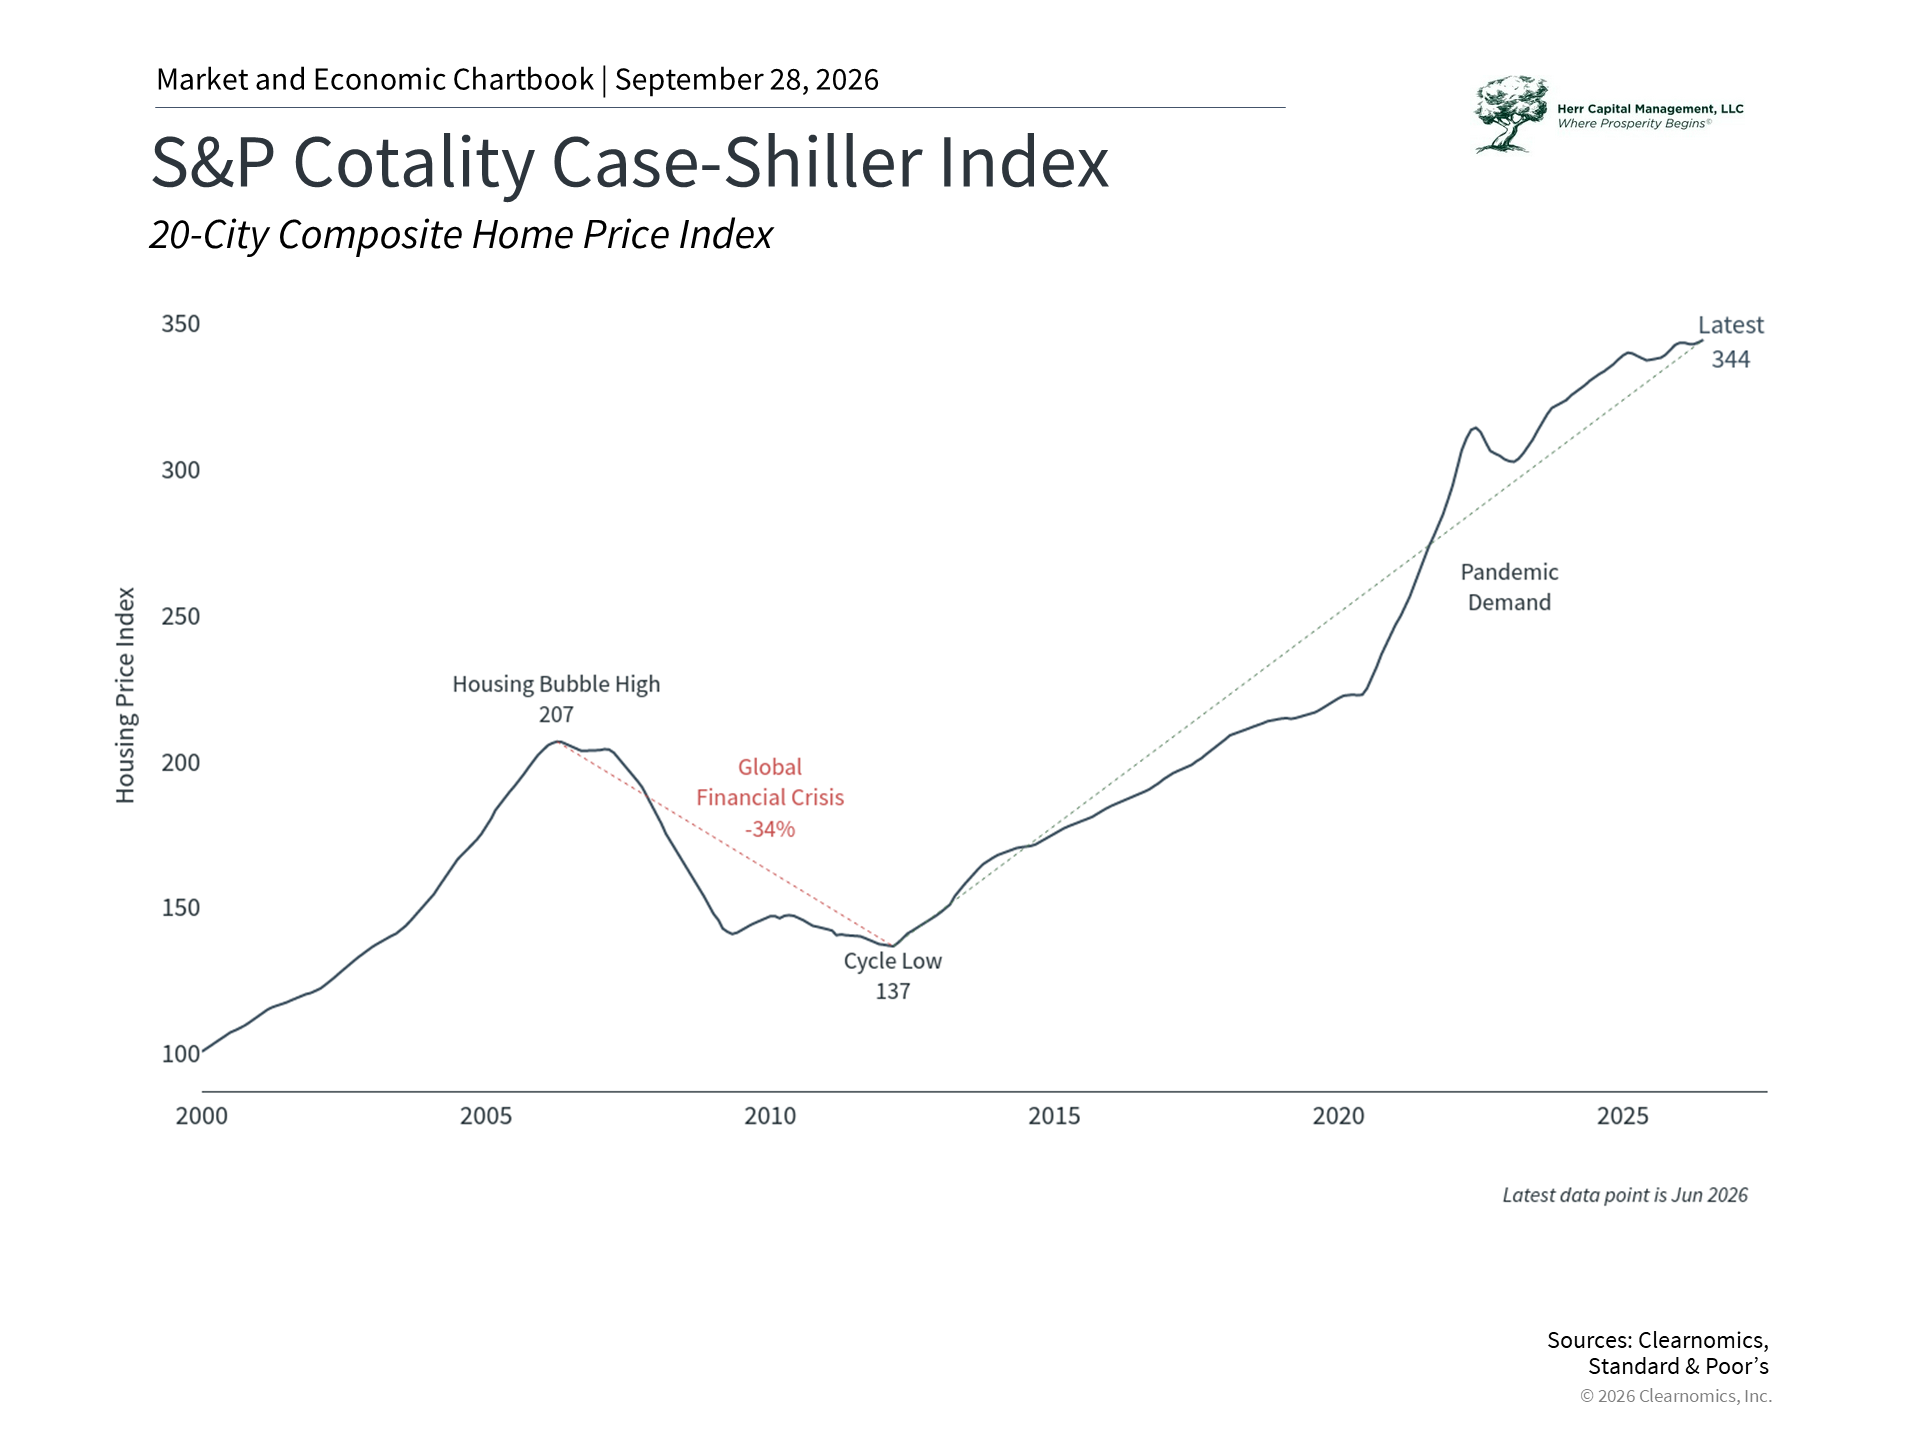 |
While transaction volumes remain low, home prices nationally remain near record highs according to the S&P Cotality Case-Shiller Index, as shown in the chart above. It’s not unusual for activity and prices to be pointing in different directions in the housing market. After all, the economy remains healthy and unemployment is low. This creates an environment in which existing homeowners are financially able and willing to pay their mortgages and stay in their homes, but may not feel a need to move.
High home prices on paper also fuel what is often known as the “wealth effect.” When households feel that their homes are holding their value or appreciating, they tend to feel more financially secure. Coupled with the stock market hovering near all-time highs, these trends can lead to greater spending on goods and services.
They may also partly explain why consumer spending has held up better than many economists expected despite concerns such as tariffs and higher energy costs. This has been the case even as consumer sentiment has remained near historic lows. One puzzle over the past several years has been the disconnect between how consumers say they feel about the economy, versus how much they spend.4
One explanation is that sentiment is fueled more by inflation, driven by factors such as higher gasoline prices this year, while spending is fueled by the wealth effect. While housing costs are an important part of household finances, making up more than one-third of the Consumer Price Index, these “shelter” costs have increased 3% over the past year while gasoline prices have jumped 27.4%.5
Refinancing activity has declined sharply
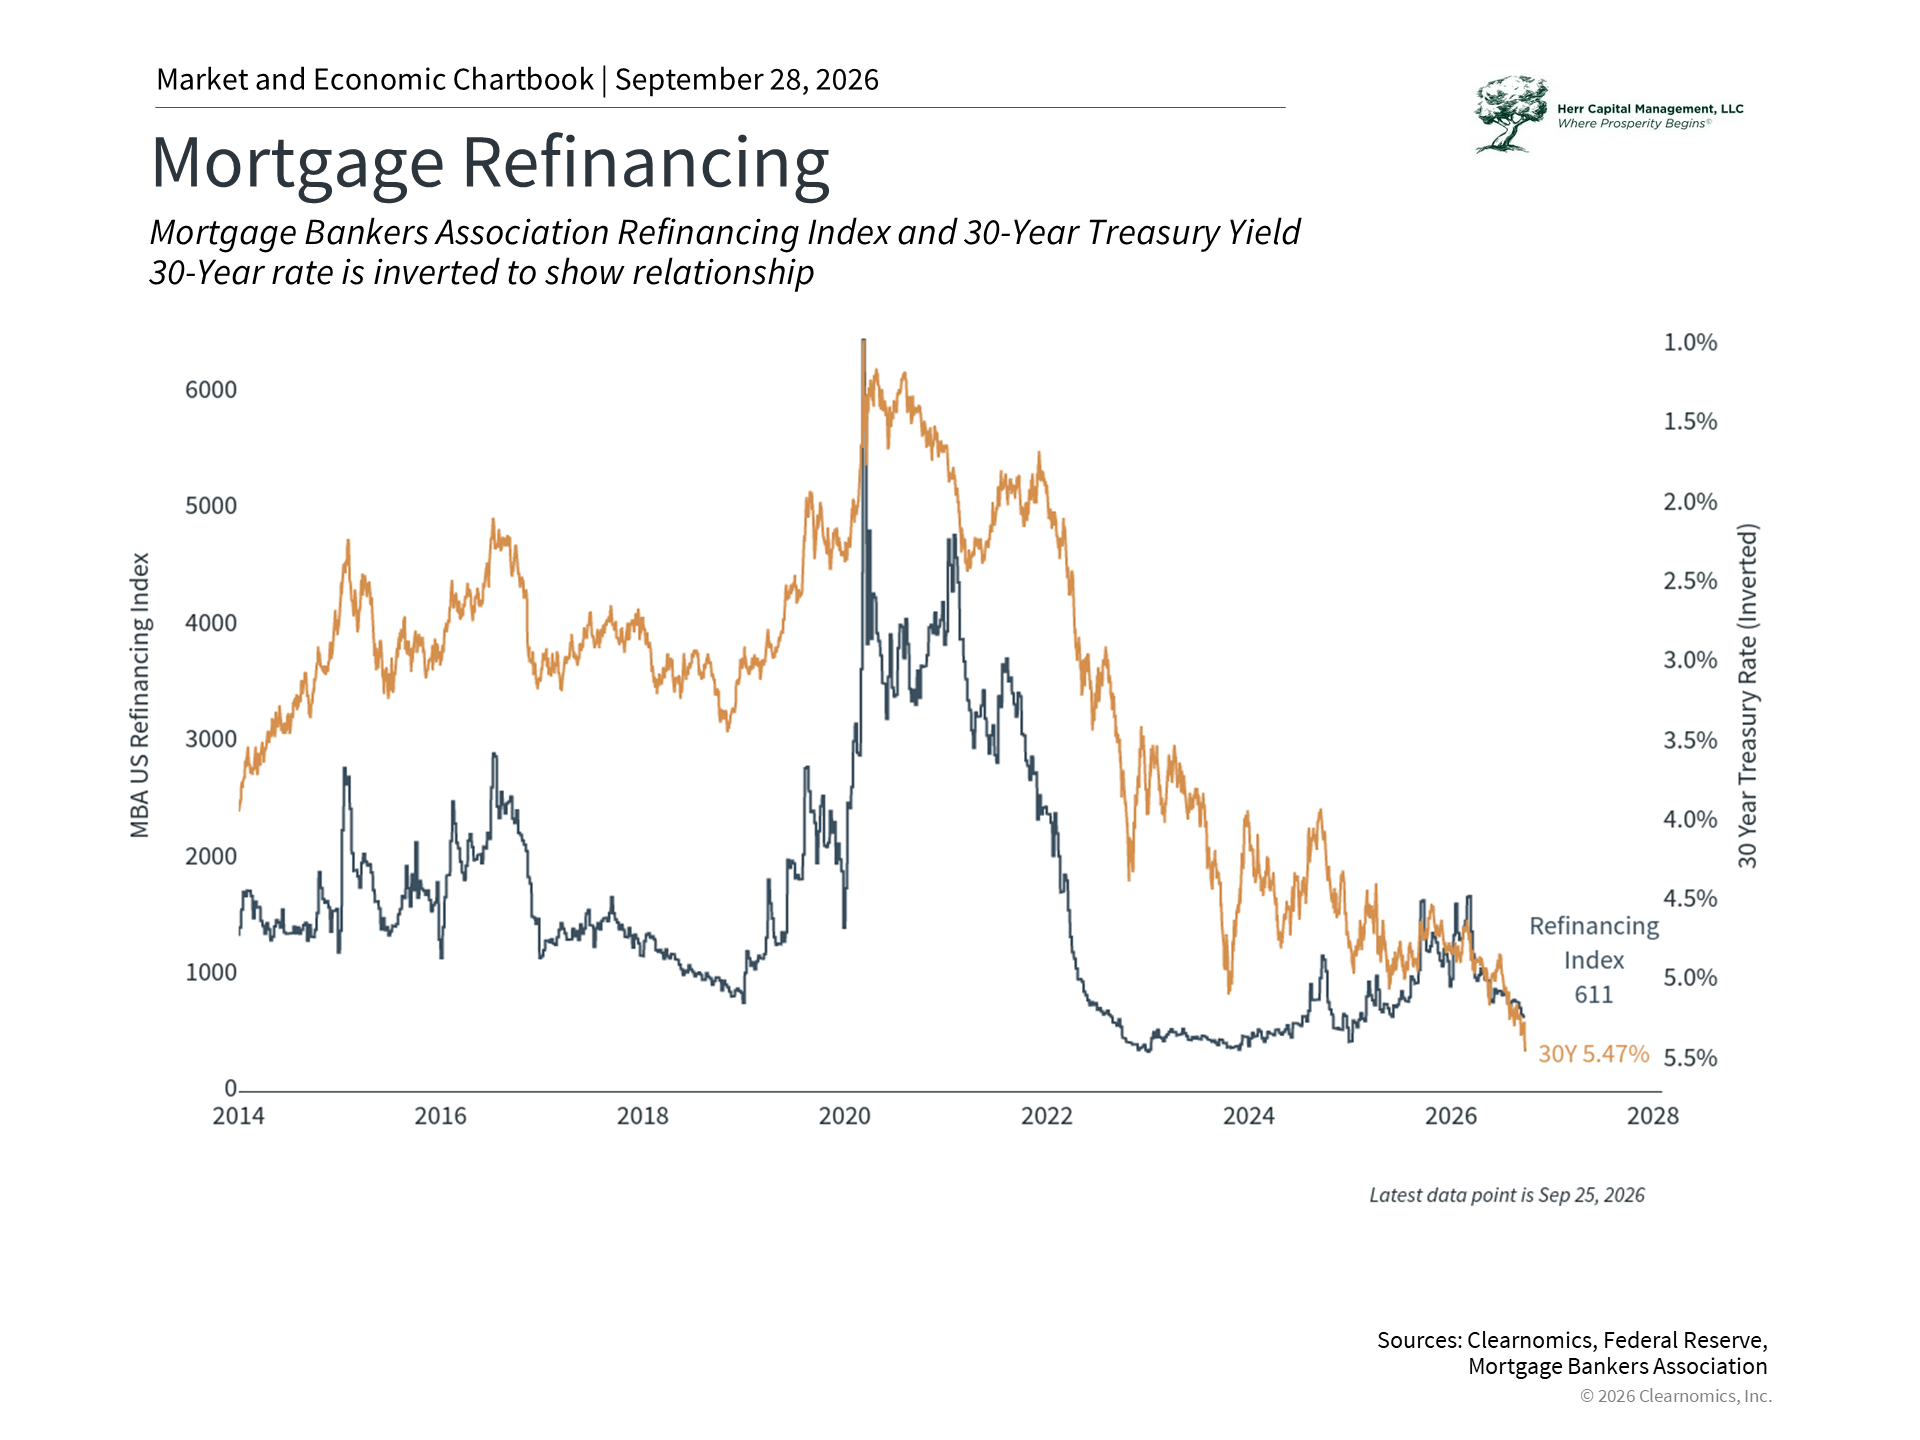 |
As long-term interest rates have risen, it’s understandable that refinancing activity has fallen sharply as well. Data from the Mortgage Bankers Association shows that refinancing volumes have declined to multi-year lows after peaking from 2020 to 2022, when many homeowners took advantage of historically low rates to reduce their monthly payments or access home equity.6
In practical terms, this means that homeowners who might otherwise have refinanced are no longer able to do so at attractive rates. Since refinancing can be a way through which households convert rising home values to spendable cash, this could potentially impact consumer spending going forward.
Still, mortgage debt remains by far the largest component of household borrowing, even as credit card and student loan balances have grown in recent years. Household debt service as a share of disposable income, which includes both mortgage and consumer debt, stood at approximately 11% in the second quarter of this year. This is still moderate relative to the pre-2008 peak of nearly 16%, suggesting that most households are managing their debt, even if they can’t access their equity.7
Of course, the effect on spending, home prices, and transaction volumes depends on how long interest rates stay high. At the moment, many interest rates across maturities are near twenty-year highs, including 5-year, 10-year, and 30-year Treasury yields.8 With inflation staying stubbornly above the Fed’s target, bond yields suggest that rates may stay higher for longer. The Fed’s own quarterly Summary of Economic Projections also suggests that policy rates could stay elevated through at least 2027.9 While interest rates are difficult to predict, especially if there are new developments with inflation, oil prices, and the job market, investors and households should continue to stay disciplined when it comes to following their financial plans.
The bottom line? The housing market may continue to be affected by rising interest rates as mortgage rates jump past 7%. For investors, this period of higher rates requires staying vigilant and focusing on long-term planning.
References
- https://www.nahb.org/news-and-economics/housing-economics/housings-economic-impact/housings-contribution-to-gross-domestic-product
- https://www.nar.realtor/newsroom/nar-existing-home-sales-report-shows-2-0-decrease-in-august
- https://www.nar.realtor/research-and-statistics/housing-statistics/existing-home-sales
- https://www.sca.isr.umich.edu/
- https://www.bls.gov/news.release/cpi.nr0.htm
- Clearnomics research and the Mortgage Bankers Association, as of September 28, 2026
- Clearnomics research and the Federal Reserve Economic Data, as of September 28, 2026
- https://home.treasury.gov/policy-issues/financing-the-government/interest-rate-statistics
- https://www.federalreserve.gov/monetarypolicy/fomcprojtabl20260916.htm
Index Descriptions S&P Cotality Case-Shiller Home Price Indices: The S&P Cotality Case-Shiller 20-City Index measures the value of residential real estate and tracks changes in the selling prices of single-family homes across 20 major U.S. metropolitan areas.
Herr Capital Management, LLC is a registered investment advisor domiciled in Illinois. This content is for information purposes and should not be construed as legal or tax advice and is not intended to replace the advice of a qualified attorney, financial or tax advisor or plan provider. Products or services mentioned on this Site will not be made available to persons resident in any state or territory where such distribution would be contrary to local law or regulation. Copyright (c) 2026 Clearnomics, Inc. All rights reserved. The information contained herein has been obtained from sources believed to be reliable, but is not necessarily complete and its accuracy cannot be guaranteed. No representation or warranty, express or implied, is made as to the fairness, accuracy, completeness, or correctness of the information and opinions contained herein. The views and the other information provided are subject to change without notice. All reports posted on or via www.clearnomics.com or any affiliated websites, applications, or services are issued without regard to the specific investment objectives, financial situation, or particular needs of any specific recipient and are not to be construed as a solicitation or an offer to buy or sell any securities or related financial instruments. Past performance is not necessarily a guide to future results. Company fundamentals and earnings may be mentioned occasionally, but should not be construed as a recommendation to buy, sell, or hold the company's stock. Predictions, forecasts, and estimates for any and all markets should not be construed as recommendations to buy, sell, or hold any security--including mutual funds, futures contracts, and exchange traded funds, or any similar instruments. The text, images, and other materials contained or displayed in this report are proprietary to Clearnomics, Inc. and constitute valuable intellectual property. All unauthorized reproduction or other use of material from Clearnomics, Inc. shall be deemed willful infringement(s) of this copyright and other proprietary and intellectual property rights, including but not limited to, rights of privacy. Clearnomics, Inc. expressly reserves all rights in connection with its intellectual property, including without limitation the right to block the transfer of its products and services and/or to track usage thereof, through electronic tracking technology, and all other lawful means, now known or hereafter devised. Clearnomics, Inc. reserves the right, without further notice, to pursue to the fullest extent allowed by the law any and all criminal and civil remedies for the violation of its rights.